Tuesday, 4 November 2008

Visualising Repository Contents

Those who have followed this blog will know that I'm a sucker for a good visualisation that provides a helpful way of displaying and accessing the contents of a collection or a whole repository.


So I read with interest about cooliris, a convincing and polished implementation of the displaywall metaphor that works on media resources described in RSS feeds. Using XSLT I turned the XML export of an EPrints search result into the required MediaRSS format (making use of the eprint item thumbnails) and embedded it into a web page as a demo. The results are best viewed in their installable full-screen viewer rather than the web page-embedded Flash program, especially if the feed extends to thousands of objects!

This technique is obviously best for visually attractive items, rather than a wall full of text-based journal articles, and would probably form an accompaniment to a collection listing, rather than replacing it.

Sunday, 26 October 2008

Patterns in Repository Access

The clocks have gone back this morning, and I was looking for something to do with my extra hour. Having tidied the kitchen cupboards, I thought I'd have a play with the Google Analytics result for our school repository.

I've only ever reported summaries of download data to our research committee - and that data is pretty constant at 30,000 full-text downloads per month, or a million papers every three years. So I was interested to see how the daily pattern of repository accesses varies over the academic year, and how that variance itself seems to repeat every year. The image attached to this posting shows the daily downloads (recorded by Google Analytics) plotted over the last year (October 27 2007 - October 26 2008) in blue, with the previous year's data also plotted in green.

The rapid oscillations are the weekly rise and fall - a peak on Mon/Tues followed by a gradual, slight decline over the week and a slump on Saturday (to around 1/3 of peak levels) with a slight rise on Sunday. Invoking Excel on the Google Analytics results, and ignoring weeks with public holidays or traditional staff vacations (where access levels are significantly lower and patterns of attendance are less predictable) the general pattern for the remaining 58 high-activity weeks' access is Monday 18%, Tuesday 18%, Wednesday 17%, Thursday 17%, Friday 16%, Saturday 7%, Sunday 8%.

What surprised me was how much the gentle falls and rises over the academic year seem so similar on both curves. The places where the match is less than exact correspond to the start of the graph (there is no data for Oct-Nov 2006) and to Easter in each year (mid March in 2007 and early April in 2008). 

I'm not sure that there's a moral to this posting, apart from the fact that there seems to be a hidden regularity in the repository downloads. I must set a student to investigate!


Tuesday, 21 October 2008

Data Access in Repositories - Don't Overlook What We Already Have!

Dorothea Salo's latest blog entry takes EPrints and DSpace to task for not being able to help users analyse (query, slice-and-dice, facet, analyse, number-crunch, mash-up) data files.

You can already do that, at least you can in Microsoft Excel anyway. As an example, I chose a data file that is already in the MINDS reporisoty (DSpace) and one that is in my school repository (EPrints) and created a new spreadsheet on my desktop that referenced data ranges in both of the archived data sets. I have put it on the Web so that you can check it out yourselves.

The screen shot shows the new spreadsheet that calculates the average publication date of the 2900 records in the ARCL WSS dataset, and the count of the number of data points in A Longitudinal Study of Self Archiving .


The Excel cell reference syntax isn't very pretty - it is a backward compatible munging (that's a technical term) of a URL into a UNC syntax. (And by the way, the munging was done automatically by Excel 2008 on a Mac.)
=COUNT('http:[//eprints.ecs.soton.ac.uk/13906/3/TIMINGS.xls]a.txt'!B2:J1617)
=AVERAGE('http:[//minds.wisconsin.edu/bitstream/handle/1793/23529/ACRLWSS.Resource.2007.xls]ACRLWSS.Resource.2007'!$H$2:$H$2940)
It is an interesting issue, to think what the data-oriented functions are that a repository can provide. However, we should not overlook the functions that we already have! And in the future, I would hope that URI-based data reference will become common-place in all our desktop applications.

Wednesday, 15 October 2008

Repository Benefits - Expertise Finding

The UK's continuing focus on research assessment has led some repository managers to offer the repository as the key means of gathering evidence of research outputs for their institutions. The experience of those repository managers has been distilled into a set of recommendations for repository management.

A notable consequence of our obsession with research assessment is an enhanced role for research management within the institution. Suddenly all the senior managers want to know how best to capitalize on our existing strengths to make the most of future funding and publishing opportunities. And that means knowing what our strengths are. And that means knowing what our researchers do. And how they work together to do it best. And that's where the repository comes in - capturing our institution's intellectual outputs and providing services over them.

So my boss has asked for our repository to provide an Expertise Finder - for him to be able to find out what groups of people are working together in any particular area.

As it turns out that was quite easy to do as the repository already creates "communities of practice" focused around each person -the screendump on the left is taken from my school publication page. The cloud of names shows all of my co-authors, and the size of each name is related to the number of times they have written a paper with me.

All we had to do was put that functionality into an export plugin so that the authors from any set of papers can be visualised in the same way. That way you can find out who is involved in a specific topic like "Web Science" by doing a search for "Web science" and exporting the results as an "author cloud". You can try it out on our repository.

Now he wants this as a network diagram so he can see the relationships between the named authors, how they fall into subgroups who work together, and which people link up the different groups. I think we'll have something developed soon, and I hope that it'll be useful to other repository managers!

Tuesday, 14 October 2008

A Present for Open Access Day!

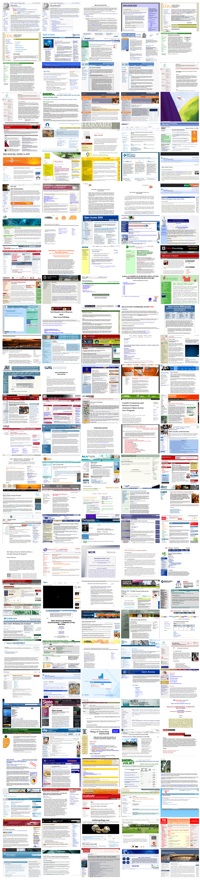
Here's a present for Open Access Day 2008 - a handy patchwork quilt made from the top 150 Open Access resources on the Web!

Well, it's not really a quilt - it's a web page. But it is lovingly stitched together from thumbnails of the highest ranked web pages that Google returns on the subject of Open Access. However involved you are with open access and institutional repositories, I bet you haven't seen a lot of this material.

Click on the image to the left (a thumbnail of the whole quilt) and it will take you to the quilt page. There, each resource is represented by a clickable thumbnail that will take you to the real page. Of course, you can get much the same result by doing a Google search for Open Access, but it's not as jolly and cheerful.

Ho ho ho! Happy Open Access Day!


Monday, 21 July 2008

Top Gear, Top Blokes

Fans of the BBC's Top Gear show are having to wait 21 years for studio tickets as the waiting list is now over 336,000 people long, according to Autoblog.

Mind you that's nothing compared to the 100 year wait that institutional repository fans might have to endure to reap the benefits of the ROAD project's latest experiment. In a stunt very reminiscent of the Top Gear program, Stuart Lewis and his team of repository torturers are going to stuff a million items into the ingest interfaces of DSpace, EPrints and Fedora repositories. If this really were "Top Gear", two repositories would explode and the winner would be Stuart Lewis with a wallet of rewritable DVDs. Since this isn't "Top Gear" all that will happen is that some of the repositories might slow down unacceptably and will need to have their storage or metadata modules re-engineered to work efficiently at this scale.

But what's the 100 year wait about? That's how long it would take for an Institutional Repository working at full efficiency to accumulate a million items, given that the average institution has about 1000 academics who each deposit a research or teaching output around once a month (or 10 times a year given time off for vacations and admin). That makes about 10K items per year, 100K items per decade or a million items per century accruing to your repository. And given that most IR's aren't operating at that level of efficiency yet, the Repository Managers of the next century can safely drink a toast to the ROAD team for setting their minds at ease.

Thursday, 10 July 2008

Open Access: Nurture? Or Nature?

In the aftermath of the announcement about Nature depositing author postprints into PubMedCentral, I tried to use papers from Nature as an example for some EPrints sessions I am running at an Open Access workshop at the International Centre for Theoretical Physics (ICTP) in Trieste. This morning I was trying to find some papers for the delegates to practise depositing into an EPrints repository, and I have discovered that you need an ICTP library password to be able to download Nature PDFs - there isn't a blanket IP subscription. Fair enough, I have no problem with how they manage their subscription. However, it turns out that if I go to Nature.com's front page, I am forbidden from seeing the picture of Nature magazine's current front page! Literally I get the normal web page with a hole in it - and a request to type in my subscription password.

This is the difference between what I see from my home institute and at ICTP.
With SubscriptionWithout subscription
Now, I don't really think that Nature is trying to withhold a commercially valuable image from dirty-rotten-internet-freeloading-scoundrels. I am sure that it was just a mistake in translating company policy into HTML code. But I the fact that such a mistake is possible is evidence that Nature is genuinely conflicted between subscription access thinking and open access thinking. This is what my friend Stevan Harnad has recently pointed out - on the one hand Nature is offering something positive for OA, but on the other hand they are still restricting OA. On reflection and on balance, it would be better for them to give us what we cannot take for ourselves (permission for immediate OA) rather than giving us what we could have done anyway (deposits in PMC and repositories).

Some have suggested it is rather churlish or ill-mannered of Stevan to point this out, and that we should be grateful and just shut up. I don't agree. We still want Open Access to Research Outputs, not a 6-month intellectual headstart for paying customers.