Sunday 26 October 2008

Patterns in Repository Access

The clocks have gone back this morning, and I was looking for something to do with my extra hour. Having tidied the kitchen cupboards, I thought I'd have a play with the Google Analytics result for our school repository.

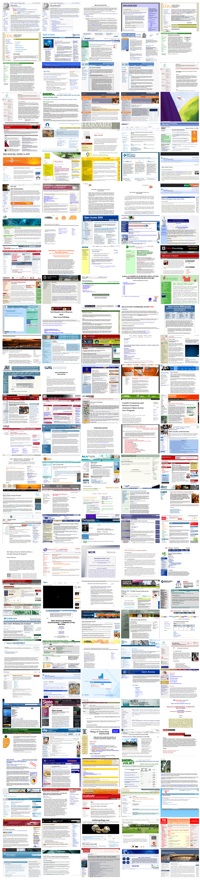
I've only ever reported summaries of download data to our research committee - and that data is pretty constant at 30,000 full-text downloads per month, or a million papers every three years. So I was interested to see how the daily pattern of repository accesses varies over the academic year, and how that variance itself seems to repeat every year. The image attached to this posting shows the daily downloads (recorded by Google Analytics) plotted over the last year (October 27 2007 - October 26 2008) in blue, with the previous year's data also plotted in green.

The rapid oscillations are the weekly rise and fall - a peak on Mon/Tues followed by a gradual, slight decline over the week and a slump on Saturday (to around 1/3 of peak levels) with a slight rise on Sunday. Invoking Excel on the Google Analytics results, and ignoring weeks with public holidays or traditional staff vacations (where access levels are significantly lower and patterns of attendance are less predictable) the general pattern for the remaining 58 high-activity weeks' access is Monday 18%, Tuesday 18%, Wednesday 17%, Thursday 17%, Friday 16%, Saturday 7%, Sunday 8%.

What surprised me was how much the gentle falls and rises over the academic year seem so similar on both curves. The places where the match is less than exact correspond to the start of the graph (there is no data for Oct-Nov 2006) and to Easter in each year (mid March in 2007 and early April in 2008). 

I'm not sure that there's a moral to this posting, apart from the fact that there seems to be a hidden regularity in the repository downloads. I must set a student to investigate!


Tuesday 21 October 2008

Data Access in Repositories - Don't Overlook What We Already Have!

Dorothea Salo's latest blog entry takes EPrints and DSpace to task for not being able to help users analyse (query, slice-and-dice, facet, analyse, number-crunch, mash-up) data files.

You can already do that, at least you can in Microsoft Excel anyway. As an example, I chose a data file that is already in the MINDS reporisoty (DSpace) and one that is in my school repository (EPrints) and created a new spreadsheet on my desktop that referenced data ranges in both of the archived data sets. I have put it on the Web so that you can check it out yourselves.

The screen shot shows the new spreadsheet that calculates the average publication date of the 2900 records in the ARCL WSS dataset, and the count of the number of data points in A Longitudinal Study of Self Archiving .


The Excel cell reference syntax isn't very pretty - it is a backward compatible munging (that's a technical term) of a URL into a UNC syntax. (And by the way, the munging was done automatically by Excel 2008 on a Mac.)
=COUNT('http:[//eprints.ecs.soton.ac.uk/13906/3/TIMINGS.xls]a.txt'!B2:J1617)
=AVERAGE('http:[//minds.wisconsin.edu/bitstream/handle/1793/23529/ACRLWSS.Resource.2007.xls]ACRLWSS.Resource.2007'!$H$2:$H$2940)
It is an interesting issue, to think what the data-oriented functions are that a repository can provide. However, we should not overlook the functions that we already have! And in the future, I would hope that URI-based data reference will become common-place in all our desktop applications.

Wednesday 15 October 2008

Repository Benefits - Expertise Finding

The UK's continuing focus on research assessment has led some repository managers to offer the repository as the key means of gathering evidence of research outputs for their institutions. The experience of those repository managers has been distilled into a set of recommendations for repository management.

A notable consequence of our obsession with research assessment is an enhanced role for research management within the institution. Suddenly all the senior managers want to know how best to capitalize on our existing strengths to make the most of future funding and publishing opportunities. And that means knowing what our strengths are. And that means knowing what our researchers do. And how they work together to do it best. And that's where the repository comes in - capturing our institution's intellectual outputs and providing services over them.

So my boss has asked for our repository to provide an Expertise Finder - for him to be able to find out what groups of people are working together in any particular area.

As it turns out that was quite easy to do as the repository already creates "communities of practice" focused around each person -the screendump on the left is taken from my school publication page. The cloud of names shows all of my co-authors, and the size of each name is related to the number of times they have written a paper with me.

All we had to do was put that functionality into an export plugin so that the authors from any set of papers can be visualised in the same way. That way you can find out who is involved in a specific topic like "Web Science" by doing a search for "Web science" and exporting the results as an "author cloud". You can try it out on our repository.

Now he wants this as a network diagram so he can see the relationships between the named authors, how they fall into subgroups who work together, and which people link up the different groups. I think we'll have something developed soon, and I hope that it'll be useful to other repository managers!

Tuesday 14 October 2008

A Present for Open Access Day!

Here's a present for Open Access Day 2008 - a handy patchwork quilt made from the top 150 Open Access resources on the Web!

Well, it's not really a quilt - it's a web page. But it is lovingly stitched together from thumbnails of the highest ranked web pages that Google returns on the subject of Open Access. However involved you are with open access and institutional repositories, I bet you haven't seen a lot of this material.

Click on the image to the left (a thumbnail of the whole quilt) and it will take you to the quilt page. There, each resource is represented by a clickable thumbnail that will take you to the real page. Of course, you can get much the same result by doing a Google search for Open Access, but it's not as jolly and cheerful.

Ho ho ho! Happy Open Access Day!